Plot styling
This notebook shows how to use the mespy style globally or on a per-call basis, and how to override the main styling parameters of mp.histogram and mp.lin_fit.
Imports
import matplotlib.pyplot as plt

import mespy as mp


df_hist = mp.load_csv("data/test_misure.csv")
lunghezza = df_hist["lunghezza_mm"]

df_fit = mp.load_csv(
    "data/test_linear_fit.csv",
    required_columns=[
        "tempo_s",
        "spazio_m",
        "sigma_spazio_m",
        "sigma_tempo_s",
    ],
    missing="error",
)

tempo = df_fit["tempo_s"]
spazio = df_fit["spazio_m"]
sigma_spazio = df_fit["sigma_spazio_m"]
sigma_tempo = df_fit["sigma_tempo_s"]
Global mespy style
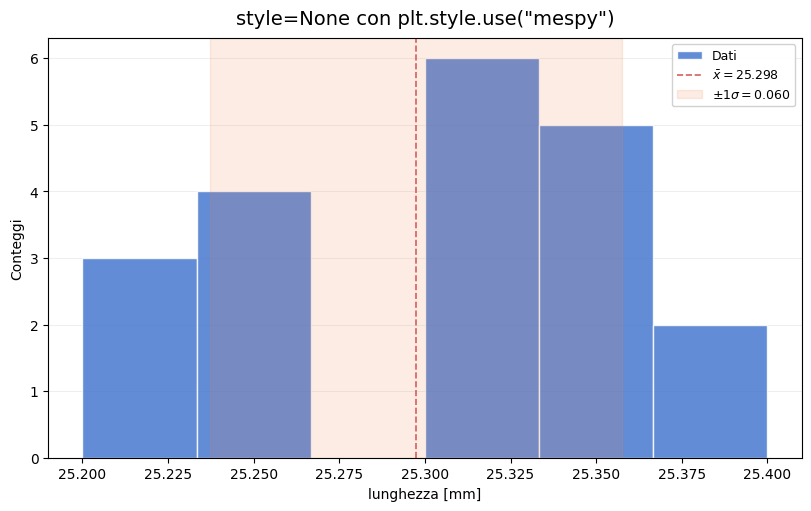
After import mespy, the package style is registered in Matplotlib and can also be activated globally with plt.style.use("mespy"). In that case, you can pass style=None to mespy functions so they use the already active rcParams without reapplying a local style.
plt.style.use("mespy")

mp.histogram(
    lunghezza,
    style=None,
    bins=6,
    xlabel="lunghezza [mm]",
    title='style=None con plt.style.use("mespy")',
    show_bin_ticks=False,
)
(<Figure size 800x500 with 1 Axes>,
 <Axes: title={'center': 'style=None con plt.style.use("mespy")'}, xlabel='lunghezza [mm]', ylabel='Conteggi'>)
Targeted overrides for histogram
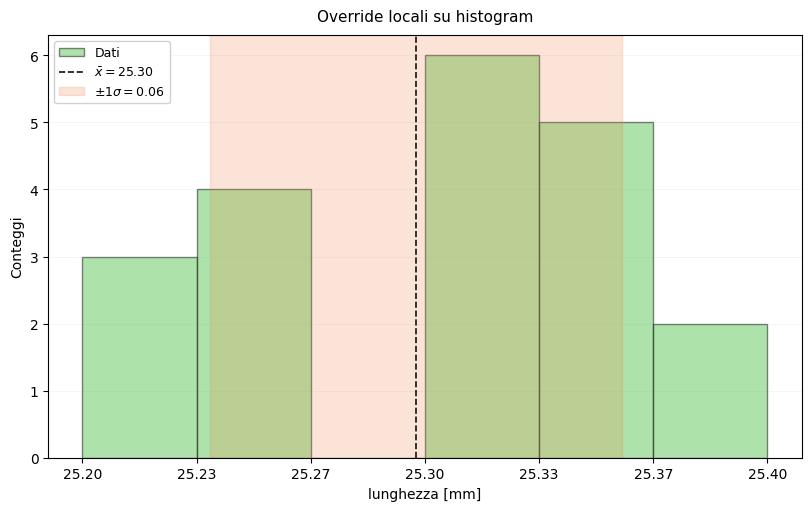
The styling parameters passed to the function override only that call. Here we change colours, opacity, legend placement, and title formatting without touching the rest of the notebook.
mp.histogram(
    lunghezza,
    bins=6,
    style="mespy",
    xlabel="lunghezza [mm]",
    title="Override locali su histogram",
    title_fontsize=11,
    legend_loc="upper left",
    bar_color="#6ACC64",
    edgecolor="#1F1F1F",
    mean_color="#111111",
    band_color="#EE854A",
    hist_alpha=0.55,
    band_alpha=0.22,
    grid_alpha=0.18,
    decimals=2,
)
(<Figure size 800x500 with 1 Axes>,
 <Axes: title={'center': 'Override locali su histogram'}, xlabel='lunghezza [mm]', ylabel='Conteggi'>)
Targeted overrides for lin_fit
The same pattern applies to lin_fit: some parameters can be left to the active style, while others can be redefined only for the current plot.
fit_style = mp.lin_fit(
    tempo,
    spazio,
    sigma_spazio,
    sigma_x=sigma_tempo,
    style="mespy",
    xlabel="tempo [s]",
    ylabel="spazio [m]",
    title="Override locali su lin_fit",
    title_fontsize=11,
    legend_loc="upper left",
    point_color="#4878CF",
    fit_color="#D65F5F",
    band_color="#6ACC64",
    data_alpha=0.85,
    band_alpha=0.18,
    grid_alpha=0.18,
    show_fit_params=True,
)

{
    "slope": round(fit_style.slope, 3),
    "intercept": round(fit_style.intercept, 3),
    "iterations": fit_style.iterations,
    "converged": fit_style.converged,
}
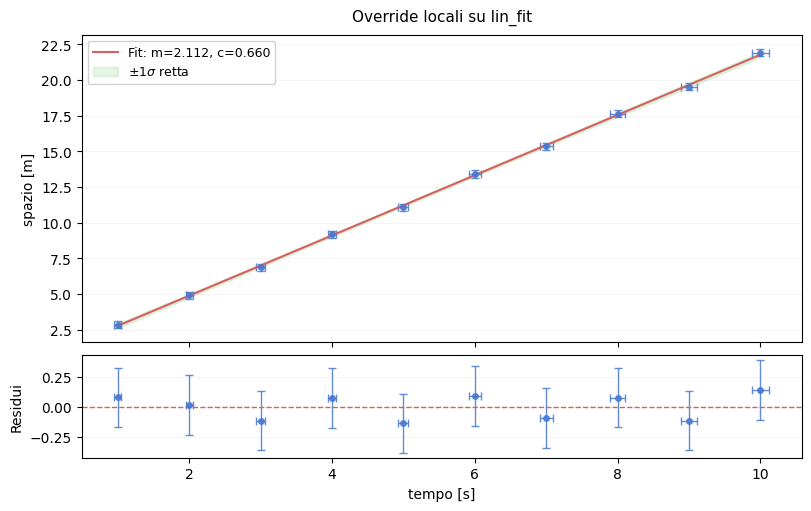
{'slope': 2.112, 'intercept': 0.66, 'iterations': 4, 'converged': True}